Core themes and results
Below is a summary of our results, expressed in key indicators. In our annual report we describe in detail which factors influenced this development and to what extent they contributed to the result.
Results, towards 2030
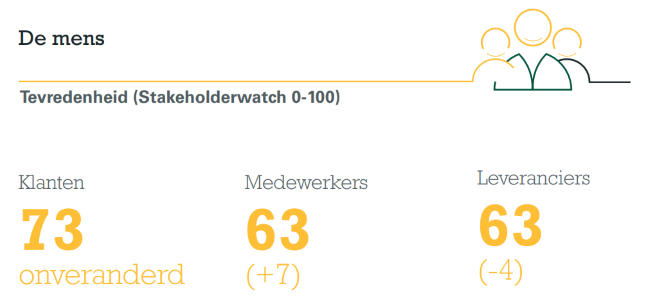
De mens
The level of satisfaction among our employees, customers and suppliers is an important indicator of our performance. We have been measuring satisfaction in the Netherlands since 2019 with 'StakeholderWatch', a research method in which customers, employees and suppliers are surveyed on a daily basis. This makes it work as a continuous 'thermometer' that makes it possible to see trends faster and therefore react faster. This is in contrast to many other measurements and studies that show more the score of a moment and less the development. StakeholderWatch expresses satisfaction as a number between 0 and 100.
2020
With a score of 73, customer satisfaction remains the same as in 2019. If we zoom in further, we see a slightly declining customer satisfaction among our delivery customers as a result of the catering lockdown and the largely standstill of company catering. Our ZBs, on the other hand, won in this period in terms of satisfaction and attractiveness, partly due to the quality of ranges and skilled employees. We see a strong improvement in satisfaction among employees. We qualified the score for 2019 (56) as 'too poor' and prompted us to invest in various improvement programs under our People Strategy, including our culture as a listed family business. We see a capricious picture among suppliers in 2020. After the score 67 at the end of 2019, satisfaction first improved to score 70 at the end of Q1. This was followed by a weakening in Q2 with another recovery in Q3. On balance, supplier satisfaction in Q4 (score 63) is slightly lower than last year. Here too you can see the influence of the catering lockdown and the partial standstill of company catering. As a result, the commercial forecasts had to be adjusted downwards during the year with specific suppliers.
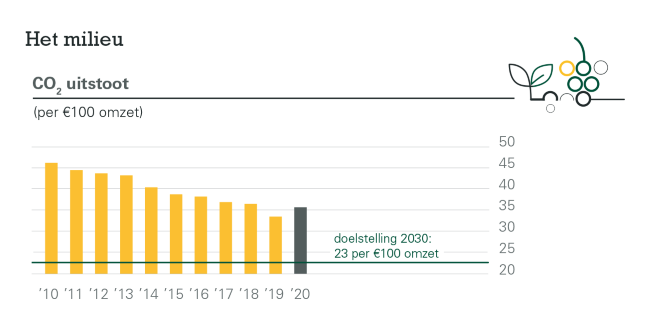
Het milieu
Onze scope betreft de uitstoot van CO2 als gevolg van verbruik van gas, elektriciteit en de gereden kilometers voor de goederenvervoersbewegingen van en naar alle groothandels, klanten, distributiecentra en onze productielocaties in Nederland en België. De CO2 uitstoot is gerelateerd aan de vaste conversie parameters uit 2010. Dit om onze jaarlijkse reductie van CO2 uitstoot ten opzichte van 2010 goed te kunnen monitoren. Onderstaande grafiek laat onze ontwikkeling sinds 2010 zien.
2020
In 2020 hebben wij voor het eerst sinds 2010 de trend van continu verbeteren doorbroken. Het verbruik van elektriciteit, gas en brandstof voor transport nam in absolute zin weliswaar af, maar doordat onze omzet daalde met 18,7%, is onze CO2 -uitstoot per euro omzet omhoog gegaan. Dit leidde tot een afname van de verbetering tot 22,7% (verlaging ten opzichte van 2010).
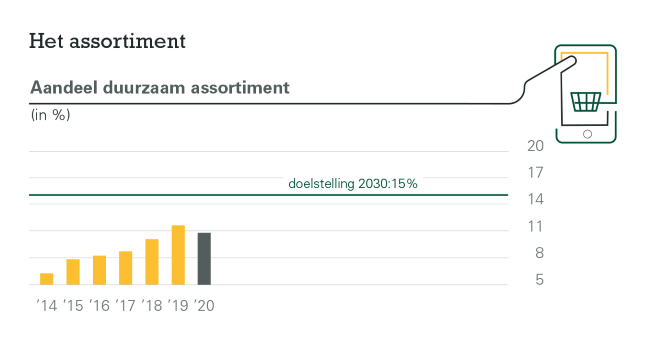
Het assortiment
Wij beschikken over een zeer breed assortiment van ruim 75.000 artikelen. Voor dit assortiment hebben we een duidelijke duurzaamheidsfocus: we stimuleren klanten tot het maken van een duurzame keuze. Sinds 2010 hebben we ons duurzame assortiment inzichtelijk gemaakt in het concept eerlijk & heerlijk. Hiermee helpen we klanten op een eenvoudige manier wegwijs te worden in de wereld van duurzame food en non-food producten en bij het maken van een verantwoorde keuze. De duurzame waarde van ieder artikel borgen we door te werken met onafhankelijke keurmerken. Wij toetsen de voortgang aan de hand van het omzetaandeel van het eerlijk & heerlijk assortiment.
2020
Overheidsmaatregelen als thuiswerken en het sluiten van de horeca hadden grote gevolgen voor het omzetaandeel eerlijk & heerlijk. Vooral het inkoopvolume van bedrijfscateraars nam in 2020 fors af en daarmee liep ook het omzetaandeel eerlijk & heerlijk terug.